
Quantitative Literacy in the Time of COVID-19
This blog is part of a series exploring the Launch Years recommendations.
 The recently released report Launch Years: A New Vision for the Transition from High School to Postsecondary Mathematics presents seven recommendations for improving student transitions from high school to postsecondary mathematics and the workforce.
Here, guest author Dr. Victor Piercey explores the importance of quantitative literacy for an informed citizenry.
Modernizing mathematics curriculum content is a key element of Launch Years Recommendation 1: Secondary and postsecondary institutions offer multiple effective and aligned mathematics pathways.
During a crisis, accurate information can save lives, but the misinterpretation of data can cost them. Since the World Health Organization declared COVID-19 to be a pandemic, we have been inundated with data and graphs on the spread of the COVID-19 coronavirus. To make responsible decisions based on data, it is critical that the public be quantitatively literate—that is, people need to be able to interpret quantitative information and make responsible decisions based on that information.
Let’s look at some examples of the kind of quantitative information in the news lately, all of which require basic quantitative literacy skills to unpack.
The Role of Graphs in Storytelling
Graphs are powerful, and they appeal to our natural visual processing power. As we have seen throughout the news and social media in recent months, the public has been looking to data and graphs to make meaning of the COVID-19 pandemic. But it’s clear from the graphs and memes that have circulated, this data must be constructed and read carefully. Reading graphs critically is a key component of quantitative literacy.
Let’s start with one of the most highly circulated COVID-19 graphs— showing “flattening the curve.”
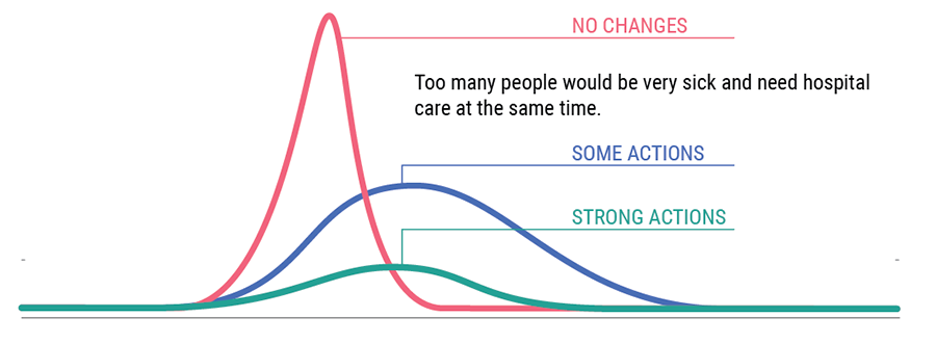
For this graph to be useful, the reader needs to understand the story it tells. They need to know what the axes describe (even when the axes are implicit), and what it means when a curve passes the line indicating health care system capacity. This graph tells us why social distancing measures and stay-at-home orders are necessary.
Here are a few more graphs. In this case, both graphs share the same data: the number of U.S. cases of COVID-19 between January 22 and April 22, 2020 (source: Johns Hopkins University). But they look totally different. Why?
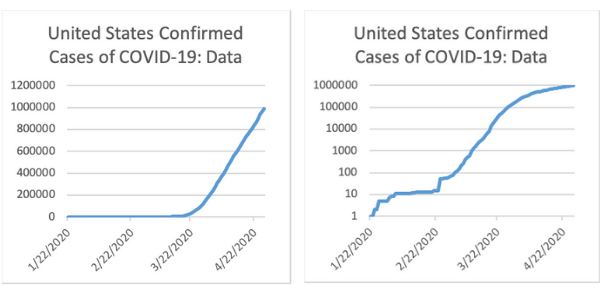
Pay Attention to Scale
A quantitatively literate reader of these graphs will notice that the scale on the left is in terms of powers of 10 (a logarithmic scale) while the scale on the right is in absolute figures (a linear scale).
This distinction will help the reader understand why the shape is different, but they should also notice more. It is easier to use the log plot to tell us how quickly the disease is spreading. In particular, using a logarithmic scale makes it easier for us to compare the US case growth to that of other countries, as in the following graph:
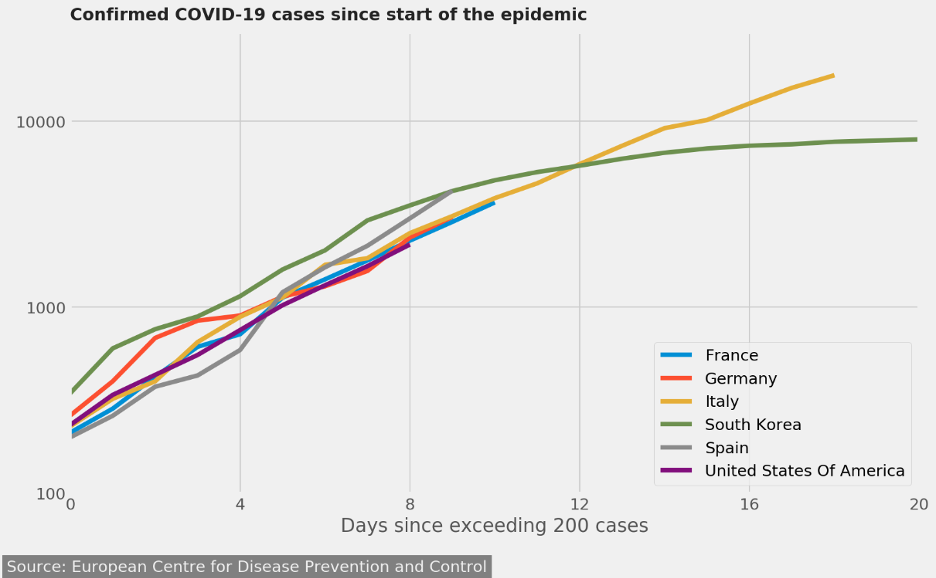
Reading these graphs carefully can help the public weigh the costs and benefits of policy decisions, which can inform their own behavior.
Unfortunately, misleading graphs are ubiquitous.
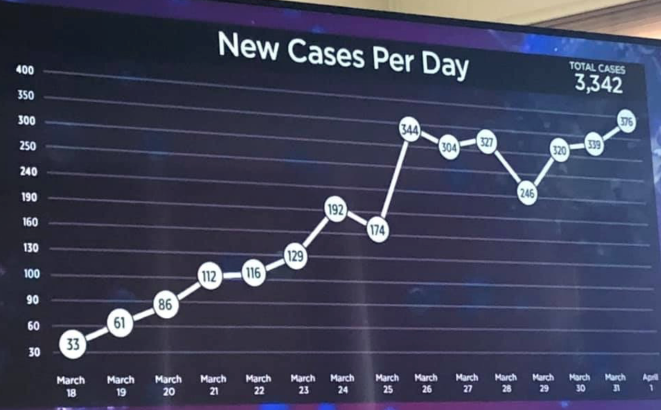
This graph is from a local television broadcast in a major urban area in the U.S. As with the logarithmic and linear scale graphs above, a quantitatively literate reader will examine the y-axis scale and notice that it is not consistent.
The vertical scale starts in increments of 30 cases for the first three gridlines, followed by a smaller jump from 90 to 100. Higher up there are jumps from 190 to 240, 240 to 250, and from 250 to 300. While the numerical information may be informative, the purpose of the graph is to say something about the growth of the number of cases over time, and the lack of consistency of the vertical scale renders that purpose moot. This raises questions about the rhetorical purpose of the graph.
Data Quality is Key
A quantitatively literate consumer of news will look under the hood of the data presented to raise useful questions. It is easy for those who don’t like the answers to dismiss the data as “fake,” but mere dismissal without evidence and analysis isn’t useful.
With coronavirus data, we don’t yet have enough testing in the U.S. to know how many cases we really have. That doesn’t mean that these data are useless, though. A quantitatively literate reader will know how to interpret the data in this context—that our data are lower bounds. This reader will also focus on the direction of the graph, not just the absolute numbers it depicts. They understand that trends tell us what we really need to know.
Rates, Ratios, and Proportions: How to Make Comparisons
A key component of quantitative literacy is proportional reasoning—understanding rates, ratios, and proportions. We have seen comparisons of the number of COVID-19 deaths to the number of seasonal flu deaths. As the number of deaths from COVID-19 has grown, memes have circulated depicting increasing number of flu deaths, from 8,000 to 113,000 to 640,000. In most if not all cases, the purpose for the comparison is to argue that we are overreacting to the COVID-19 pandemic.
Assuming the seasonal flu figures in such memes are correct, they do not tell us about the time frame during which these deaths occur. Nor do they provide a geographic scope. Therefore, we cannot make accurate comparisons between the rate flu deaths compared to COVID-19 deaths.
As of April 30, 2020, according to data from Johns Hopkins, the official death toll from COVID-19 in the United States was 60,997. (The first death officially tied to COVID-19 in the United States was recorded on February 29, 2020.) In order to compare deaths due to flu to those due to COVID-19, we would need to know the number of flu deaths in the United States during the same time period. And without this comparison, we lose track of questions such as the capacity of our health care system to handle the pandemic, which brings us full circle back to “flattening the curve.”
The Importance of Quantitative Literacy
Quantitative literacy is a vital skill for an informed citizenship and should receive more attention in our mathematics curriculum. Does this mean we need to abandon algebra? No. “Algebra vs. quantitative literacy” is a false dichotomy (see Piercey, 2017).
That dichotomy raises the concern of tracking—in which the math courses that students take determine their future opportunities.
So, what is to be done? Algebra should be infused with quantitative literacy. To do that, we need to include learning outcomes such as the careful and skeptical reading of graphs and data with our algebraic work. “Word problems” can be enhanced to promote quantitative literacy using real-world situations and applications, such as those we explored above related to COVID-19. Further, rigorous quantitative reasoning courses include many algebraic skills and concepts that can help students who decide to take more algebraically intensive courses in the future.
When we take a more holistic approach to mathematics education, looking at the learning outcomes needed for career aspirations and an informed citizenry, we all benefit.
The COVID-19 crisis is forcing our society to rethink much of what we have all taken for granted. Let’s think about what we can rethink about the mathematics curriculum as well.
For Further Reading
- How Math Predicts the Coronavirus Curve, Dave Kung, The Great Courses Plus. [Video]. https://www.youtube.com/watch?v=POmuHKzt7HA&t=1s
- Piercey, Victor I. "A Quantitative Reasoning Approach to Algebra Using Inquiry-Based Learning." Numeracy 10, Iss. 2 (2017): Article 4. DOI: http://doi.org/10.5038/1936-4660.10.2.4
- Hamman, K., and Kung, D. “A Delicate Balance: Quantitative Literacy and Equity”, MAA FOCUS, December 2016/January 2017, p. 14 – 15. https://www.maa.org/sites/default/files/pdf/pubs/focus/pdf_FOCUS%20Dec16Jan17.pdf
Graph Sources
- Graph 1: https://www.healthwise.org/blog/slowing-the-spread-of-covid-19.aspx; modified by this post’s author to clarify health care system capacity line.
- Graph 2 and 3: Author created these graphs with data from Johns Hopkins Data Workbooks: https://data.humdata.org/dataset/novel-coronavirus-2019-ncov-cases
- Graph 4: From a Reddit post on March 14, 2020 https://www.reddit.com/r/dataisbeautiful/comments/fikeof/oc_confirmed_covid19_cases_in_logarithmic_scale/. Graph created with data from the European Centre for Disease Prevention and Control https://www.ecdc.europa.eu/en/publications-data/download-todays-data-geographic-distribution-covid-19-cases-worldwide
- Graph 5: Picture from https://statmodeling.stat.columbia.edu/2020/04/04/interesting-y-axis/

About the Author
Victor Piercey
Victor Piercey is Professor of Mathematics and the Director of General Education at Ferris State University in Michigan. His primary work at Ferris has involved the development of a 2-semester sequence of general education courses entitled Quantitative Reasoning for Professionals.
Get in Touch
We collaborate with states, districts, and teachers to develop innovative curricula, resources, and professional development.